This is a short primer on scientific data sufficient for big data experts who may nonetheless be scientific data newbies. There are many technical details only some of which are described in detail here. This primer focuses on only the some of the basic aspects of scientific data essential to begin developing an understanding of how to design Spark or Hadoop applications to perform sophisticated analysis. Many advanced issues are ignored including…
- non-cartesian coordinate systems
- arbitrary polyhedra
- high order elements
- mixing materials
- revolved or refined meshes
- regular/implicit topologies
- non-zero tensor rank fields
- ghost zones
- ensembles other than basic time-series.
Meshes
A mesh is a collection of points typically in 2 or 3 dimensional space connected together to form polygonal (2D) and/or polyhedral (3D) primitive pieces called elements. In general, a mesh is represented as two lists.
- A list of the points comprised of coordinate tuples (xy or xyz).
- A list of the elements comprised of point-id tuples
 |
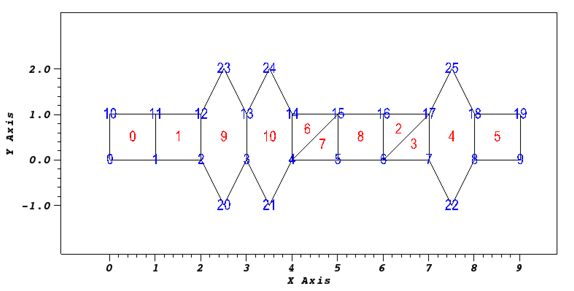
In many ways, this representation is analogous to a vertex-list and edge-list representation of a graph. For example, for the 2D mesh pictured here, these two lists would look like…
POINTS:    0:(0.0,0.0), 1:(1.0,0.0), 2:(2.0,0.0), 3:(3.0,0.0), ...
           ...23:(2.5,2.0), 24:(3.5,2.0), 25:(7.5,2.0)

ELEMENTS:  0:(0,1,11,10), 1:(1,2,12,11), 2:(6,17,16), 3:(6,7,17), 4:(7,22,8,18,25,17), ...
           ...10:(3,21,4,14,24,13)
Note the ordering of the points in the lists defining each polygonal element in this example. The ordering is based on the right-hand-rule. The points are ordered in the direction the tips of your fingers curl when holding your right with thumb perpendicular to the page and towards you.

So far, we have described the vertices and the elements. What about the edges? For example, what about the edge joining points 0 and 1? On the one hand, the list of points for an element implies its edges meaning we do not necessarily need to explicitly list them. For example, for element 3, we can read the list of points comprising the element, 6, 17, 16, and immediately write down the edges by taking pairs of points in order, 6 & 17, 17 & 16 and then 16 & 6. Each of these pairs of points defines an edge. are E0:(6,7), E1:(7,17) and E2:(17,6), which joins the last point in the list with the first.
Variables
There are two basic kinds of variables; those whose data is associated with the points and those whose data is associated with the elements. For a point-centered variable, you get 1 tuple for each point in the mesh. For an element-centered variable, you get tuple for each element in the mesh. Additionally, the variable’s value across an element (e.g. in the white space inside the individual boxes) varies depending on the kind of variable it is. For an element-centered variable, its value is constant over an element. For a point-centered variable, its value varies piecewise-linearly over an element. This is important in any algorithm that requires the interpolation of data in the white space between the elements.
In addition, variables can be scalar valued, vector valued or tensor valued.
Materials and other Subsets
Time Series
Meshes and the variables defined upon them typically vary over time in a simulation. So, the simulation winds up creating many instances of the mesh and variables for each time state. In addition, in certain cases, the mesh structure can vary with time (points or elements can be either moved, added or deleted from the mesh). The result is that different time steps are captured by writing these data objects to different files (or at different places within the same files).
Parallel Decomposition
For scalable scientific computing, meshes are decomposed into chunks and processed by different parallel tasks. In the picture above, the colored regions represent different chunks the mesh is broken into.