We have created the KVMesh database to encourage research on the application of Big Data technologies to HPC problems with emphasis on the data analysis activities traditionally performed with visualization and analysis tools such as VisIt, EnSight, or ParaView.
The level of effort to develop such tools is high. Each represents perhaps 50-150 person years of software development investment. In addition, proficiency in software development often requires mastery of many separate technologies such as Lustre, GPFS, HDF5, netCDF, CMake, VTK, MPI, OpenMP, Python, Qt, XML, JSON, IceT, OpenGL, GLEW, and more recently portable performance technologies such as VTK-m, RAJA, and Kokkos not to mention various hardware vendor’s compilers and operating systems. Hiring, developing and retaining software engineering staff with these combinations of skills is both challenging and costly.
Enormous Leverage Opportunity

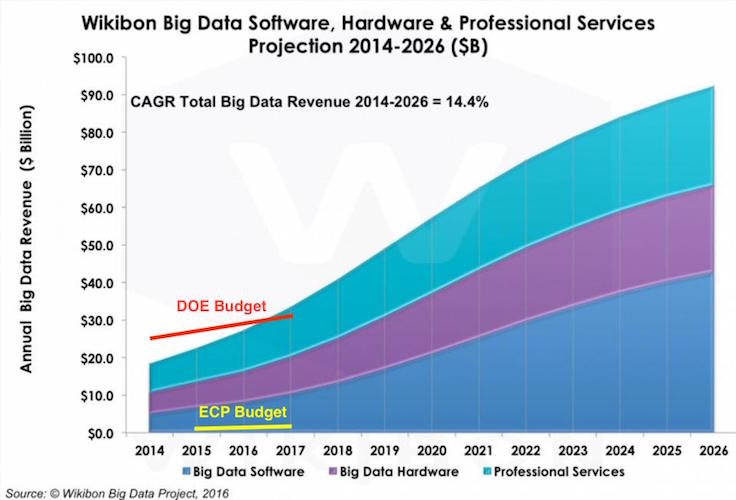
The graph here represents world-wide investments and projected investments in Big Data infrastructure software, hardware, and support services. In particular, this graph does not include the projected additional $100-$200 billion in applications created with this infrastructure. So, this graph is about development of the Big Data toolbox and not about use. It is analogous to the kind of money we spend in the development of tools like EnSight, ParaView and VisIt.
For comparison, the red and yellow lines show the entire budget of the Department of Energy (DOE) DOE and the budget of the Exascale Computing Project (ECP) ECP, respectively. Both are dwarfed in comparison to current and projected Big Data investments. Bottom line, if there is a way for the HPC community to leverage Big Data technology, the potential payoff for HPC would be enormous!
In particular, consider that more and more colleges are offering degree programs in data sciences whereas high performance computing programs are getting scarcer.
Visualization is Data Analysis

The picture here illustrates a rough architectural data-flow model for how visualization tools and VisIt in particular process data.
Processing begins with user’s data stored in parallel files in an ever growing variety of formats. With various I/O libraries (e.g. HDF5, netCDF) and parallel I/O paradigms (e.g. N:N, N:M, N:1), user’s native data is read and instantiated it into a handful of standard scientific data objects (e.g. vtkUnstructuredGrid, vtkFloatArray). Next, any one of a number of analysis operations (e.g. threshold, iso-volume, onion-peel, connected-components, etc., etc., etc.) are performed producing derivative data objects. Next, colors, surface normals, textures, lighting, camera and other visual attributes are added to generate a renderable scene. Finally, the scene is rendered in parallel. The resulting parallel images are composited together and the final image is then delivered to the user’s screen.
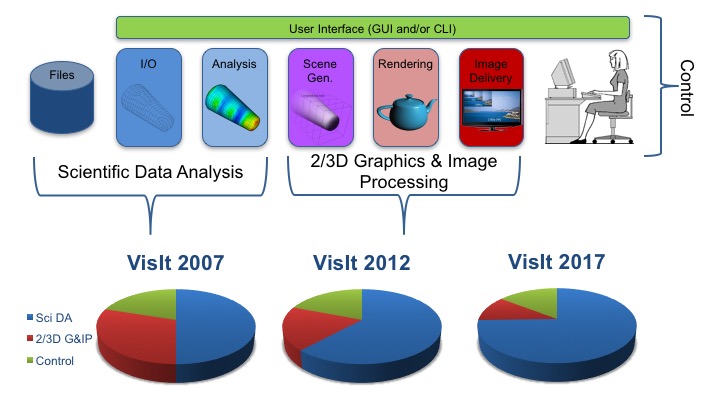
Given these various steps in data processing, we breakdown the relative lines of code in VisIt for 3 broad categories of functionality; Control, 2/3D Graphics & Image Processing and Scientific Data Analysis (SDA). The fraction of total lines of code for SDA has represented more than 50% of the code since before 2007 and today exceeds 75%. In other words, SDA represents a majority of the software development manpower invested in VisIt. Furthermore, as VisIt has evolved, investment in SDA functionality continues to outpace other functionalities. We would not be surprised if similar experiences hold for other tools.
Visualization as Database Query

Techopedia defines database query as
a request for data or information from a database […]. This data may be generated as [textual] results returned by [a query language] or as pictorials, graphs or … trend analyses from data-mining tools.
The HPC community does not typically think of interactive visualization as database query. Nonetheless, it certainly fits the definition here. Each time the user adjusts some aspect of what they are visualizing, we can think of that adjustment as a query and the result the tool produces as the response to that query.
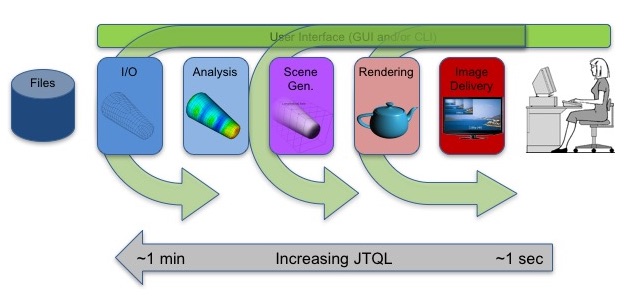
Some adjustments, such as zooming, panning or rotating the view, are very simple. Because they are simple, user’s have an expectation that the response also be fast. Other adjustments, such as changing clip planes, thresholds, iso-values, etc. involve more computation and so user’s accept longer delays.
When we talk about the length of delay between the query and the response, we’re talking about latency. In the picture here we illustrate, roughly, just tolerable query latency for various round-trip queries deeper and deeper into the visualization tool data flow. In particular, we show that longer latencies are more tolerable for queries that reach in towards the SDA end of the data flow. This is important because it is here that Big Data, although latency prone, has a good fit.
Apply Big Data where it Fits

So far, research into the application of big data technologies for scientific visualization has too frequently focused on either just the rendering end alone or on the whole end-to-end data flow. Subsequent results have been mixed at best.
- Latencies are often too big for interactive use.
- Data and/or algorithmic overheads are often unacceptably high.
- The data model mismatch is often seen as an insurmountable obstacle.
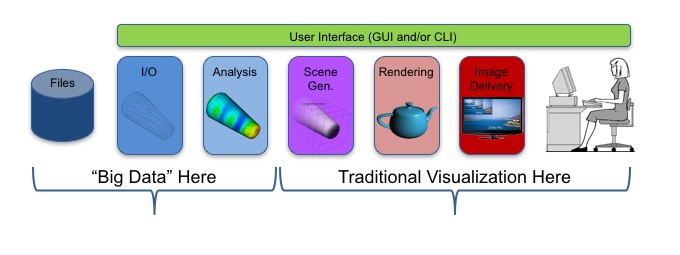
However, as we illustrate in the picture here, we believe the proper application of Big Data technologies to HPC visualization is to augment the Scientific Data Analysis functionalities of these tools. The other functionalities (Control and 2/3D Graphics & Image Processing) are probably best handled by existing technologies (Qt, Python, OpenGL).
And, as we explain in the preceding section, SDA is precisely where we are presently making our biggest software engineering investments in these tools and where we expect investments to continue to grow. This is also were latencies and overheads are most tolerable.